Lower imported prices cause headline deflation
- Details
- Category: Economic Releases
- Created: 08 October 2015
| Inflation August 2015 |
||||
| Aug 15 | Jul 15 | Jun 15 | May 15 | |
| Headline * | -1.0 | 1.6 | 0.2 | -0.6 |
| Domestic ^ | 2.6 | 3.9 | 2.6 | 1.3 |
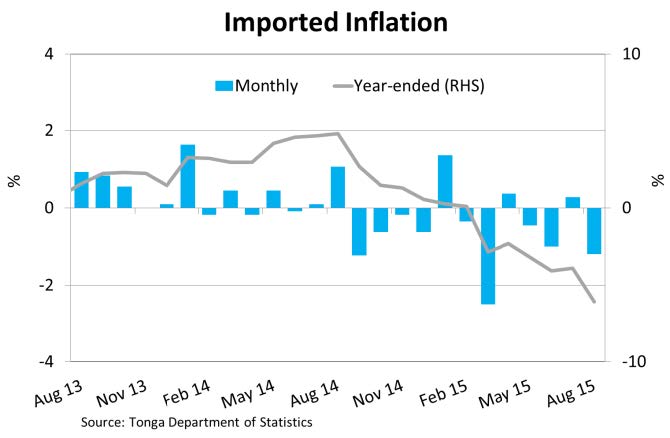
| Imported ^ | -3.6 | -2.3 | -2.4 | -1.9 |
| Underlying * | 7.9 | 9.9 | 7.8 | 5.3 |
| * Year-ended growth | ||||
| ^ Percentage point contribution to year-ended growth | ||||
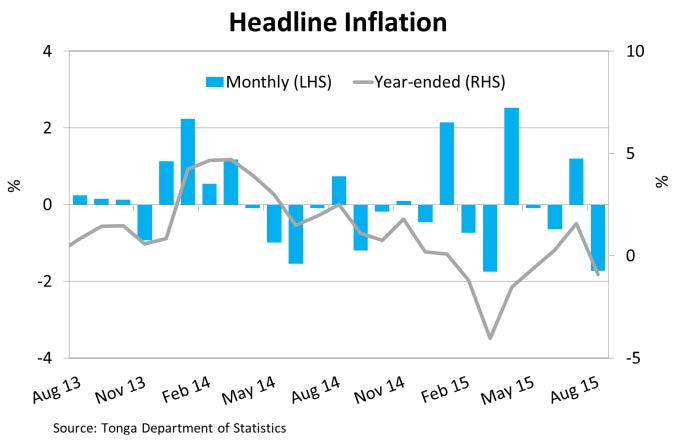
Lower imported prices cause headline deflation
CPI decreased by 1.8% over the month, which was driven by lower imported and domestic prices, particularly lower Food prices. This coincides with findings from the NRBT Liaison Program with growers that agricultural yields have improved due to better weather conditions thereby resulting in lower Domestic Food prices. Imported Food prices declined on the back of falling Dairy prices in New Zealand, namely Milk, Cheese & Eggs products as well as lower prices for Meat, Fish & Poultry. Additionally, the Tongan Pa’anga remained unchanged against the New Zealand Dollar and depreciated against the U.S. Dollar, which could have partially offset the effect of falling global oil prices on the Transportation component. Electricity prices decreased over the month driving the Household Operations component lower.
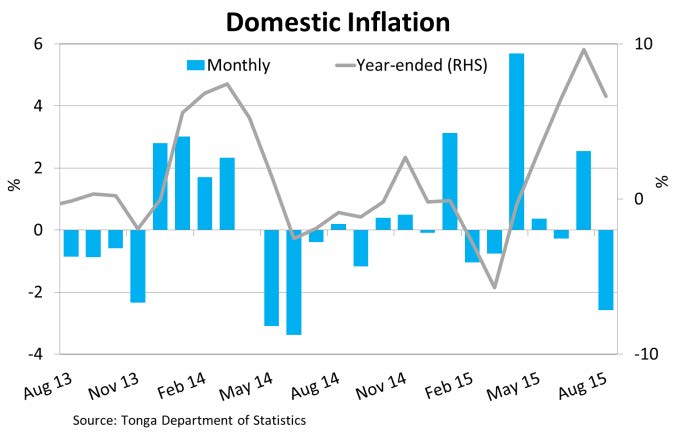
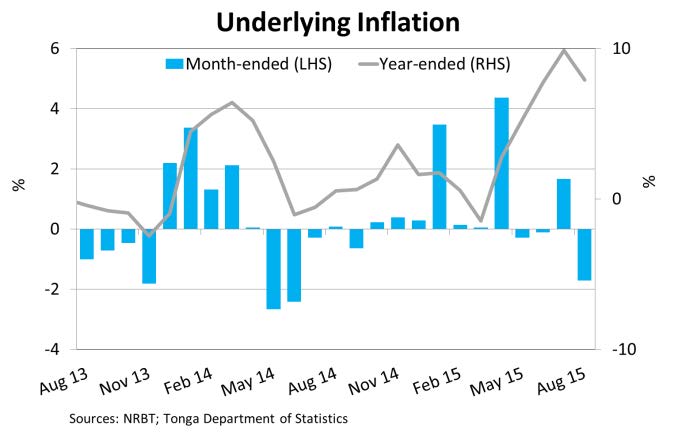
Over the year, the headline inflation rate decreased by 1.0% as a result of Imported prices, which declined by 6.0%. Specifically, Imported Food prices decreased for all food items except Dairy products and Other Food. In addition, falling Crude Oil prices resulted in lower domestic energy prices (Transportation and Household Operations components). On the other hand, Domestic prices increased over the year by 6.6% due to higher Food prices for items such as Fruit & Vegetables, and Meats, Fish & Poultry. This could have been due to the El Niño weather conditions over the year affecting agricultural output. Furthermore, the annual core inflation rate (excluding energy and imported food) increased by 7.9% indicating the significant influence global prices has on inflation.
On the outlook, the NRBT continues to expect that headline inflation will remain low until the end of this calendar year. However, risks to this forecast would be developments in world oil prices and food prices.
 |
 |
 |
 |
Inflation Breakdown *
| Weight |
Month-ended | Year-ended | |||
| Change | Contribution to total ppt |
Change | Contribution to total ppt |
||
| % | % | ||||
| CPI | 100 | -1.8 | -1.8 | -1.0 | -1.0 |
| Domestic | 42.2 | -2.6 | -1.1 | 6.6 | 2.6 |
| Food | 17.8 | -5.3 | -1.1 | 21.4 | 3.6 |
| Fruit & vegetables | 6.5 | -10.7 | -1.1 | 65.9 | 3.6 |
| Meats, fish & poultry | 3.7 | -1.0 | 0.0 | 2.3 | 0.1 |
| Dairy farm, vegetable products | 0.5 | 0.0 | 0.0 | -3.7 | 0.0 |
| Cereals & cereal products | 3.4 | 0.0 | 0.0 | -4.1 | -0.1 |
| Other food | 0.0 | 0.0 | 0.0 | 0.0 | 0.0 |
| Drinks, sweets and meal away from home | 3.7 | 0.0 | 0.0 | 0.0 | 0.0 |
| Transportation | 0.5 | 0.0 | 0.0 | 0.0 | 0.0 |
| Tobacco & Alcohol | 1.5 | 0.0 | 0.0 | 0.0 | 0.0 |
| Household Operation | 17.3 | 0.0 | 0.0 | -5.6 | -0.9 |
| Domestis Power & Fuel | 6.0 | 0.0 | 0.0 | -9.3 | -0.6 |
| Household Appliances | 0.0 | 0.0 | 0.0 | 0.0 | 0.0 |
| Household furniture & furnishing & textiles | 1.4 | 0.0 | 0.0 | 2.0 | 0.0 |
| Household supplies & services | 4.7 | 0.0 | 0.0 | -9.0 | -0.4 |
| Communication services | 5.2 | 0.0 | 0.0 | 0.0 | 0.0 |
| Clothing & Footwear | 0.0 | 0.0 | 0.0 | 0.0 | 0.0 |
| Housing | 1.7 | 0.0 | 0.0 | 0.0 | 0.0 |
| Miscellaneous goods & services | 3.5 | 0.0 | 0.0 | 0.0 | 0.0 |
| Imported | 57.8 | -1.2 | -0.7 | -6.0 | -3.6 |
| Food | 27.9 | -3.0 | -0.8 | -10.2 | -3.1 |
| Fruit & vegetables | 0.9 | 0.0 | 0.0 | -3.5 | 0.0 |
| Meats, fish & poultry | 14.6 | -5.6 | -0.8 | -18.6 | -3.2 |
| Dairy farm, vegetable products | 3.2 | -0.6 | 0.0 | 0.1 | 0.0 |
| Cereal & cereal products | 3.5 | 0.5 | 0.0 | -0.9 | 0.0 |
| Other food | 5.7 | -0.2 | 0.0 | 3.4 | 0.2 |
| Drink, sweets and meal away from home | 0.0 | 0.0 | 0.0 | 0.0 | 0.0 |
| Transportation | 11.5 | 0.0 | 0.0 | -9.1 | -1.1 |
| Private | 8.6 | 0.0 | 0.0 | -11.6 | -1.1 |
| Public | 2.9 | 0.0 | 0.0 | -0.5 | 0.0 |
| Tobacco & Alcohol | 4.5 | 1.5 | 0.1 | 9.6 | 0.4 |
| Tobacco | 2.9 | 0.1 | 0.0 | 11.8 | 0.3 |
| Alcohol | 1.6 | 4.4 | 0.1 | 5.2 | 0.1 |
| Kava | 0.0 | 0.0 | 0.0 | 0.0 | 0.0 |
| Household Operation | 3.5 | -0.3 | 0.0 | -6.1 | -0.2 |
| Domestic Power & Fuel | 1.1 | -0.2 | 0.0 | -15.8 | -0.2 |
| Household Applicances | 1.2 | 0.0 | 0.0 | 1.6 | 0.0 |
| Household furniture, furnishing & textiles | 0.0 | 0.0 | 0.0 | 0.0 | 0.0 |
| Household supplies & services | 1.2 | -0.6 | 0.0 | -3.7 | 0.0 |
| Communication services | 0.0 | 0.0 | 0.0 | 0.0 | 0.0 |
| Clothing & Footwear | 3.2 | 3.0 | 0.1 | 11.4 | 0.4 |
| Housing | 0.8 | 0.4 | 0.0 | -1.2 | 0.0 |
| Miscellaneous goods & services | 6.4 | 0.1 | 0.0 | -0.1 | 0.0 |
| Underlying CPI measures | |||||
| Ex. Energy ** | 81.4 | -2.1 | -1.8 | 1.1 | 0.9 |
| Ex. imported food | 72.1 | -1.3 | -0.9 | 3.1 | 2.1 |
| Ex. energy and imported food | 53.5 | -1.7 | -0.9 | 7.9 | 4.0 |
* Due to rounding and Tonga Department of Statistics errors some data may not aggregate precisely
** Excluded from the 'Ex energy' index is imported transportation and 'domestic fuel and power' component of 'Household operation'.
Source: Tonga Department of Statistics